- SkillsPandas, GeoPandas, Matplotlib, NetworkX, Shapely, GIS
- CodeGitHub Link
- ProgressCompleted
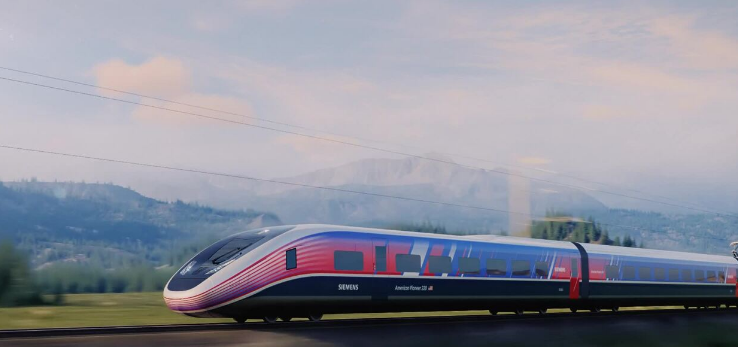
This project was inspired by my experience of various public transportation systems in Europe, Asia, and New York itself as well as my personal struggle with commuting between Boston and New York during holidays. Using the knowledge I had gained about algorithms and search spaces, and with the information I gathered regarding the infrastructure of the United States, particularly this article, I set out to design an algorithm to optimize the placement of high speed rail systems across the continent.
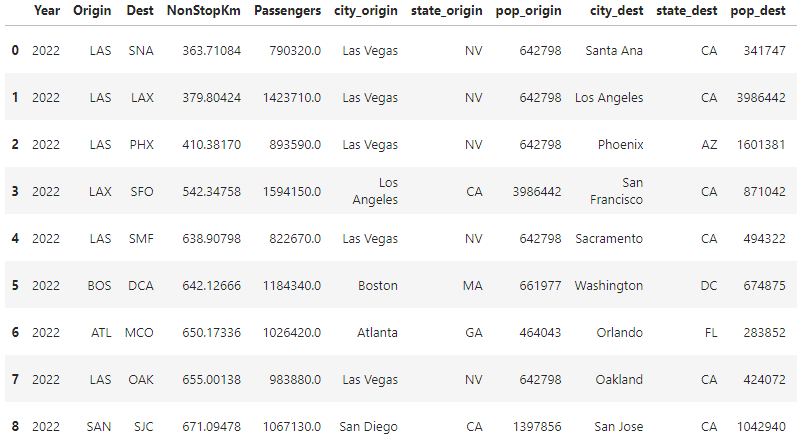
A large part of this project was a data pipeline that I created with metrics on emissions, flight markets, populations and locations of major cities, and an estimated cost of construction. This would inform the algorithm on how optimal each rail system would be, calculating the number of passengers served, the emissions saved, travel times, and so on. The data for this was mainly gathered from U.S. census data, the EPA, the AirLabs API, and the DB1B survey. A special thank you during this process to Sergey from AirLabs in particular, who gave me a student license for this project with 50,000 free API calls, which let me search for airport schedules by code, search for nearby airports using latitude and longitude, etc. and compile my dataset with ease.
The algorithm for this project is based on uniform-cost search, a variant of Dijkstra's algorithm. The algorithm systematically expands the search space, prioritizing nodes based on various factors it gets from the data pipeline, ensuring a comprehensive exploration of the solution space. Since this project lacks a heuristic, the exploration of potential rail corridors relies on the actual "costs" associated with each corridor and trying to minize the total cost of the system.
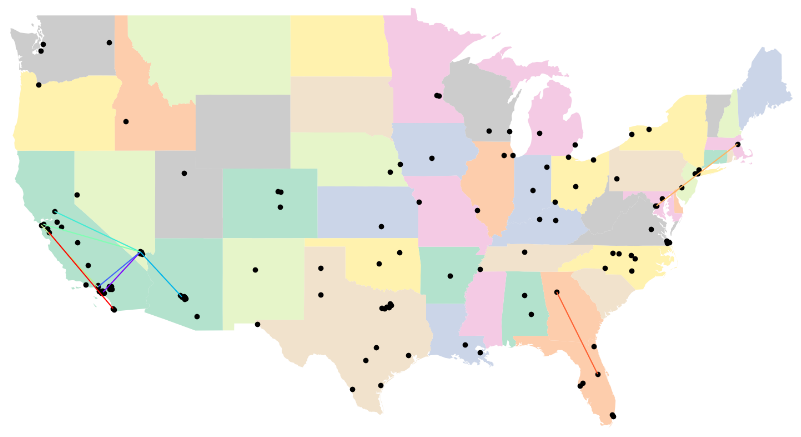
Early in the project, I realized the importance of being able to visualize what is otherwise an abstract idea when represented as a dataset of coordinates and metrics. I used GeoPandas and Matplotlib to create visualizations of the rail systems and cities, using GIS files and Shapely to map out the system over the U.S. The solution is represented in a csv table containing the ideal rail corridors in order of construction that was then visualized as below.